Why I’m Bullish on the Stock Market in 2024: A Historical Perspective

The year 2023 has been a remarkable one for the stock market. After a dismal 2022, the market bounced back with a vengeance, delivering impressive returns for investors. The S&P 500, the benchmark index for the US stock market, soared by about ~26% year-to-date, outperforming many analysts' expectations.
As an investor, I was not really surprised by the market's recovery in 2023. In fact, I predicted it in an opinion piece I wrote in December 2022, where I used historical market performance data to point out a potential market comeback in 2023. You can read my piece here.
Based on my analysis of the historical data, I concluded that the market tends to rebound strongly after a significant negative return year, such as 2022. I also followed the advice of the legendary investor Warren Buffet, who said to "be fearful when others are greedy and be greedy when others are fearful". While most investors were selling their stocks for tax loss harvesting in the fourth quarter of 2022, I took advantage of the opportunity and bought some tech stocks at bargain prices. I focused on the "magnificent 7" – AAPL, META, AMZN, NVDA, MSFT, GOOGL, and TSLA – which are the leading tech companies in the world. My strategy paid off, as these tech stocks led the market's rally in 2023.
Now, as we approach the end of 2023, a new question arises: Will the streak continue in 2024, or will the market face another slump? In this piece, I will explore this question by looking at the historical patterns of the market performance and the current factors that can influence the market's direction in 2024. While the macroeconomic outlook is not very encouraging, I still believe that the market has more room to grow in 2024, if history repeats itself.
Historical Patterns
One of the ways to predict the future of the stock market is to look at its past. The stock market has a long history, and the market has experienced many ups and downs, booms and busts, expansions, and recessions. By analyzing the historical data, we can identify some patterns and trends that can help us understand the market's behavior and anticipate its future movements.
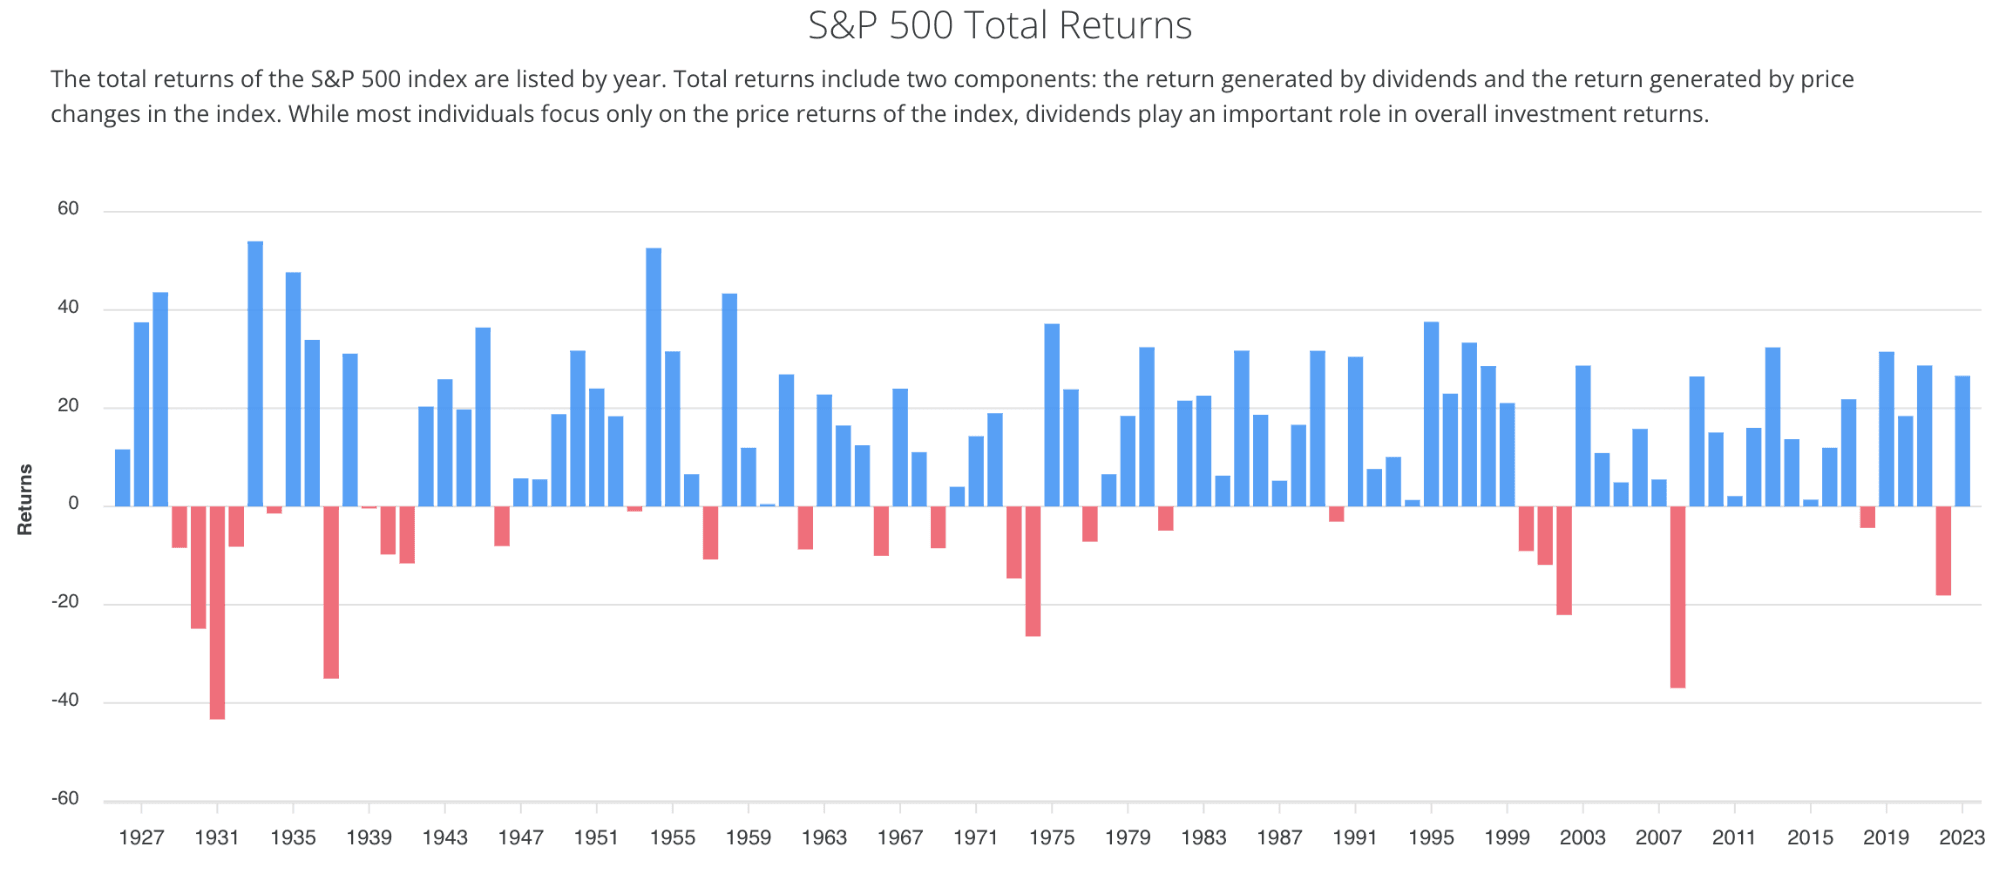
One of the patterns that I have noticed is that the market tends to deliver positive returns for three to four consecutive years after a negative return year. This pattern is based on the S&P 500 historical annual returns data, which covers the period from 1928 to 2023. According to the data, the S&P 500 has had 26 negative return years, and 13 of them were followed by three to four positive return years. The only exceptions were 1929, 1939, 1973, and 2000 which were negative return years after a negative return year.
This pattern can be explained by the market's inherent resilience and the cyclical nature of the economy. When the market suffers a downturn, it usually reflects an economic contraction, which is characterized by lower consumer spending, lower business investment, and lower corporate earnings among others. During these periods, businesses adapt to the changing environment, cut costs, improve efficiency, and innovate new products and services. Eventually, the economy begins to recover, which is marked by higher consumer spending, higher business investment, higher corporate earnings, and lower unemployment. This recovery phase is often accompanied by a surge in the stock market, as investors regain confidence and optimism.
We have seen this pattern play out in 2023, which was a recovery year after a brutal year for the stock market in 2022. The US economy rebounded, and the stock market reflected the economic recovery, as the S&P 500 hoover near all-time high (as of December 27, 2023).
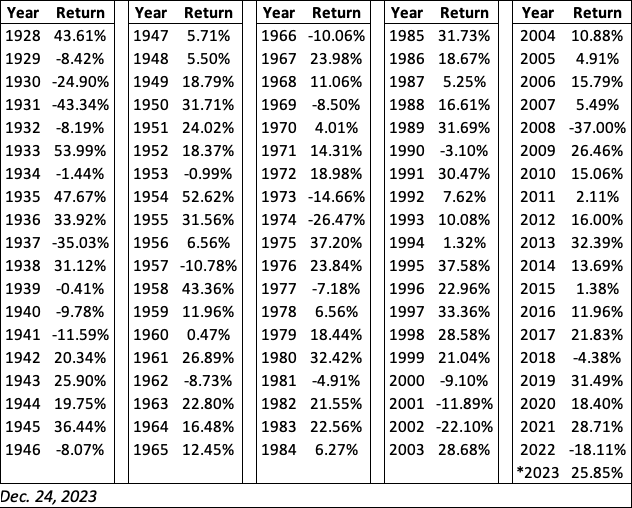
While it is difficult to predict the 2024 price of S&P 500, we can however attempt to use the historical patterns to estimate the price. The table below shows the historical annual returns of the S&P 500 index from 1928 to 2023, including both price returns and re-invested dividends. It is important to mention that my estimate of the future price of the S&P 500 index is based on the average returns of the second year after a negative return year since 1928.
Based on the data, we can see that there were 13 years out of the last 90 that had a negative return, followed by a positive return the next year. These are the years we are interested in, as they are similar to the situation we have now with 2022 and 2023. For each of the 13 years, I look at the return of the second year after the negative return year. For example, for 1934, which had a negative return of -1.44%, I look at the return of 1936, which was 33.92%. For 2008, which had a negative return of -37.00%, I look at the return of 2010, which was 15.06%. And so on.
I calculated the average of these 13 returns and used that as the average annual return for the estimation. The average of these 13 returns is about 14.54%. Using this average and assuming that it applies to the current year as well, we can estimate that there will be a positive return of 14.54% in 2024, after a negative return of -18% in 2022 and a positive return of 26% in 2023. Therefore, we can multiply the current price by (1 + r), where r is the average annual return of 14.54%. The current price of the S&P 500 as of December 27 is 4,781; so, we get $5,476 as the estimated price by the end of 2024: $4,781 * (1 + 0.1454).
This means that if there are no major shocks or disruptions in the economy or the market, we can expect that the S&P 500 index will reach about $5,476 by the end of 2024. Please note this estimate is completely based on historical data and assumptions, and it does not account for other factors that may affect future performance, such as inflation, interest rates, earnings growth, geopolitical events, etc.
Current and Future Factors
While history provides us with valuable insights, it does not guarantee future outcomes. The stock market is influenced by a myriad of factors, both internal and external, that can affect its performance in unpredictable ways. Therefore, while the historical pattern suggests a positive return in 2024, it is crucial for investors to stay informed about the current market conditions and adjust their strategies accordingly.
Looking ahead, there are several factors that can influence the market's performance in 2024. Some of the key factors to watch are:
- The technology sector. The technology sector has been the main driver of the market's performance in recent years. The S&P 500 is dominated by the technology sector, which accounts for almost a third of its value. The influence of these tech companies – mostly AAPL, NVDA, MSFT, AMZN, GOOGL, META and TSLA - Magnificent 7, cannot be overemphasized. Tech sector helped S&P 500 to gain ~26% YTD return. These tech giants have been innovating and disrupting various industries. The impact of Artificial intelligence is a game changer – mostly drove some tech companies’ earnings and stocks. NVIDIA and Microsoft benefited significantly from this innovative technology. The Magnificent 7 have been generating strong revenue and earnings growth, attracting more investors and customers. However, the tech sector also faces some challenges, such as increased competition, regulatory scrutiny, antitrust lawsuits, and geopolitical tensions. These challenges could pose some risks for the tech sector and the market in 2024. However, if the momentum of the Artificial Intelligence influence continues, I expect this to be one of the driving forces of positive stock markets performance in 2024.
- The interest rates and inflation. The interest rates and inflation are another important factor that can affect the market's performance in 2024. The interest rates are determined by the monetary policy of the Federal Reserve, the central bank of the US. The Fed has the power to raise or lower the interest rates. Recently, The Fed has paused the hikes to its benchmark rates and signal potential interest rates cut in 2024 because it looks like it’s winning the fight of the inflation. If the Fed continues with its current policy, it could create a supportive environment for the stock market.
- De-escalation of geopolitical conflicts. 2023 witnessed various global tensions, including the ongoing war in Ukraine, Middle East, and heightened China-Taiwan relations. These uncertainties weighed on investor sentiment and contributed to market volatility. However, recent signals of diplomatic efforts and potential de-escalation could unlock pent-up optimism in 2024. If geopolitical tensions subside, investors might shift their focus back to fundamentals and the inherent growth potential of the US economy and its leading companies. This could drive renewed investment in equities, specifically sectors exposed to global trade and international expansion.
- Corporate Innovation and Earnings Resilience. Despite macroeconomic headwinds in 2023, many leading companies within the S&P 500, particularly in the technology sector, demonstrated remarkable resilience and continued innovation. Their focus on research and development, and cost optimization has translated into sustained earnings growth. For 2024, a continued pipeline of innovative products and services, coupled with efficient cost management, could further strengthen these companies' performance, and attract investor interest. This, in turn, could lift the broader market.
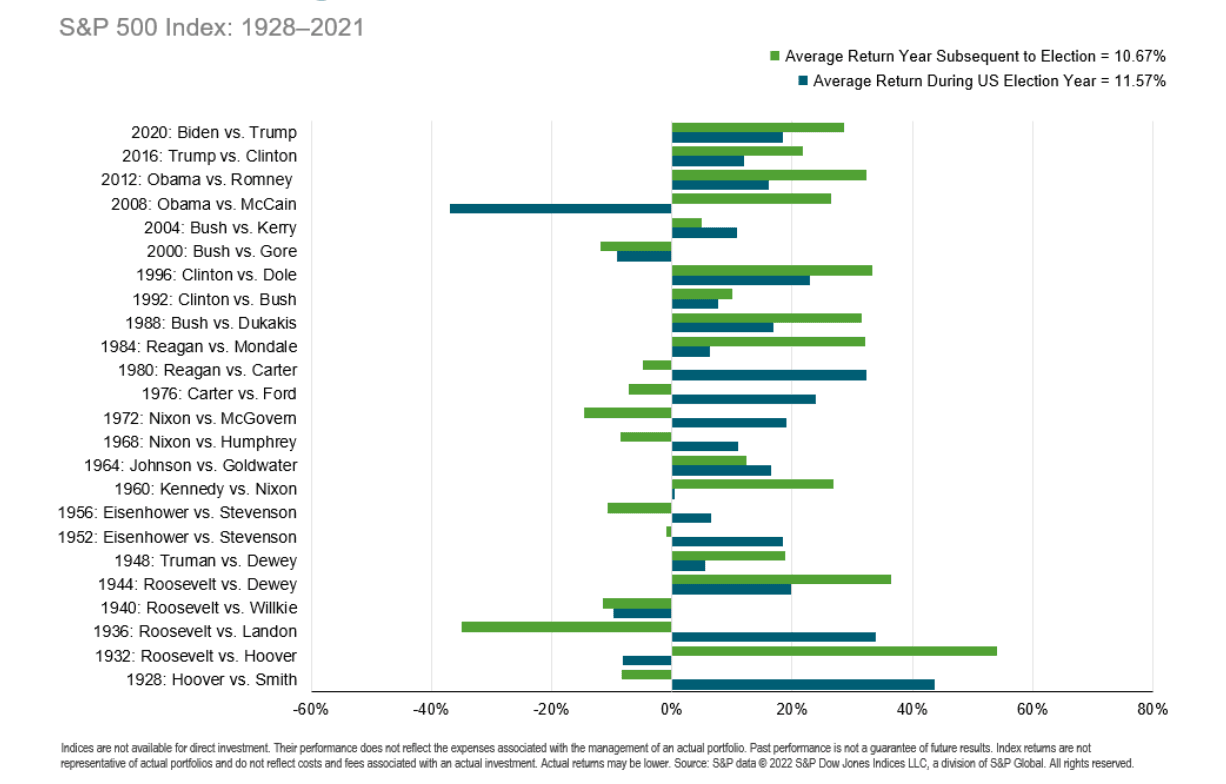
- Political wild card in 2024. Adding another layer of complexity to the 2024 forecast is the upcoming US presidential election. While predicting the outcome and its economic impact is notoriously difficult, the potential for policy changes and regulatory shifts cannot be ignored. Candidate's regulatory stances will be crucial for informed investment decisions. Less regulatory tones could have positive impact on the stock markets. To look at this from historical pattern perspective, the S&P 500 index tends to perform better in the year before an election than in the first year of a new administration. This is because investors tend to wait for more clarity and policy direction before making major decisions, while also taking advantage of lower volatility and uncertainty. While the market generally performs better in the year before election, I expect positive performance in 2024, maybe at a lower return versus 2023 (pre-election year) as indicated in the chart below.
Bottom Line
The stock market has had a remarkable year in 2023, recovering from the slump of 2022 and delivering impressive returns for investors. The market's recovery was in line with the historical pattern, which shows that the market tends to rebound strongly after a negative return year. However, the historical pattern does not guarantee future outcomes, and the market's performance in 2024 will depend on various factors, such as the technology sector, the interest rates, and the inflation, geopolitical de-escalation, and US presidential election. While history and current market conditions suggest a positive outlook for the stock market in 2024, investors should remain cautious and diversified their portfolio. It’s always wise to remember that the stock market is unpredictable and subject to fluctuations. So, stay vigilant, maintain a play book, and constantly re-assess your strategies and stick to whatever plan you’ve developed – short or long-term.
Disclaimer: The content and materials available on this site are not intended to serve as financial, investment, trading, or any other form of advice or recommendation from Trading Terminal.
More from Femi Agboola, CFA
 December 28, 2024
2025 Outlook: Historical Cycles and the Case for a Sustained Bull Market
 December 28, 2023
Why I’m Bullish on the Stock Market in 2024: A Historical Perspective
 May 31, 2023
NVIDIA: Leading the AI Pack for Investment
 May 5, 2023


