

Are We in a Bear Market Bottom? Buffett Indicator Says Not Yet
 Femi Agboola, CFAOctober 17, 2022
In this environment of rising inflation and interest rates – honestly, an incredible moment for short sellers – it doesn’t look like the stock market bleeding will stop anytime soon. It’s shocking that the S&P 500 has dropped -22% YTD and the QQQ by a whopping -32%. I have seen several commenters on different platforms over the last few weeks saying that stocks are cheap, markets are undervalued, we should all buy, and so on.
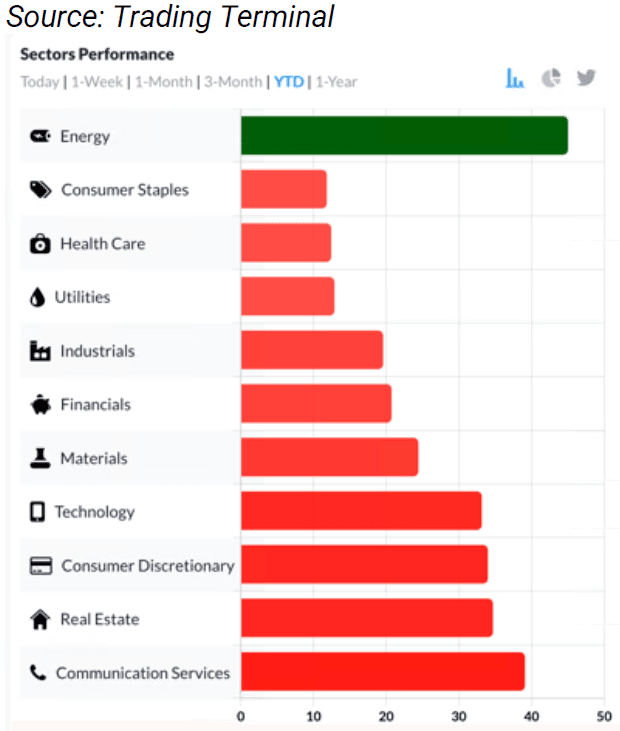
Almost all sectors have performed strongly over the past few years. Consequently, when the stocks of top companies are down by - 40%+ YTD, you might think they’re extremely cheap. If you analyze the market and some of these stocks, however, you’ll realize that they aren’t, in fact, that cheap.
Take a look at the chart above. As of October 14, 2022, all sectors except energy show negative double-digit performances. Are they, therefore, cheap? Are we at the bottom? The Buffett Indicator says otherwise. While I do not recommend trying to time the market (because, as they say, time in the market generally beats timing the market), having tools at your disposal such as the Buffett Indicator, S&P 500 mean reversion, Shiller PE ratio, and interest yield curve, in addition to macro, sector, and technical analysis, will enable you to successfully manage your portfolio.
We are going to check to see if the stock market is currently undervalued and if we are close to the bottom using one of these tools. In this analysis, the focus is on the Buffett Indicator valuation model. One caveat, though: can the Buffett Indicator (BI) perfectly predict the market? I don’t think so. It has its pros and cons. As a result, it’s best to use the BI in conjunction with other tools before making any investment decisions as it’s not expected to provide consistent predictions. Also, it’s very important to consider geopolitical and global macro conditions as well. Now, let’s delve into the BI to assess whether the market is at the bottom or just getting started.
The Buffett Indicator (BI) is the ratio of the total U.S. stock market to the U.S. gross domestic product (GDP). Investors use the BI to gauge whether the market is undervalued, fair valued, or overvalued. The BI theory is that the stock market should rise as the GDP rises, and the deviation of the total market value shouldn’t logically be significantly higher or lower than the GDP.
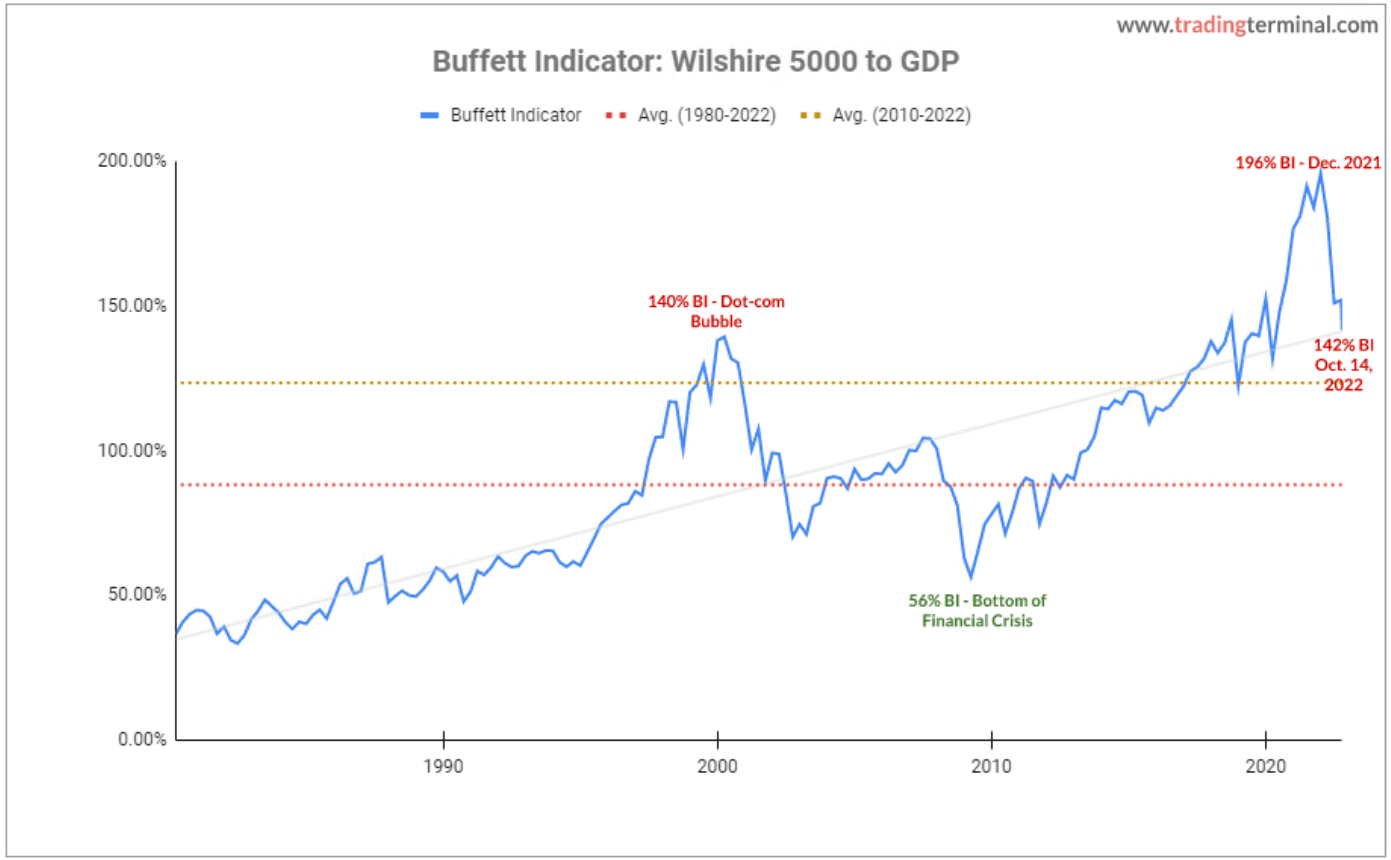
Warren Buffett once called the BI “the best single measure of where valuations stand at any given time.” According to him, you are playing with fire if the ratio approaches 200% – anything above 120% is overvalued. As of October 14, 2022, the BI ratio stands at 142%. It was 196% in December 2021, which was an all-time high. Ironically, we did not only play with fire in December 2021 – we were already on fire. The result of this fire is currently being seen across the board as the majority of stocks (especially tech stocks) are already down by high double-digits YTD. Some are even at their two-year lows.
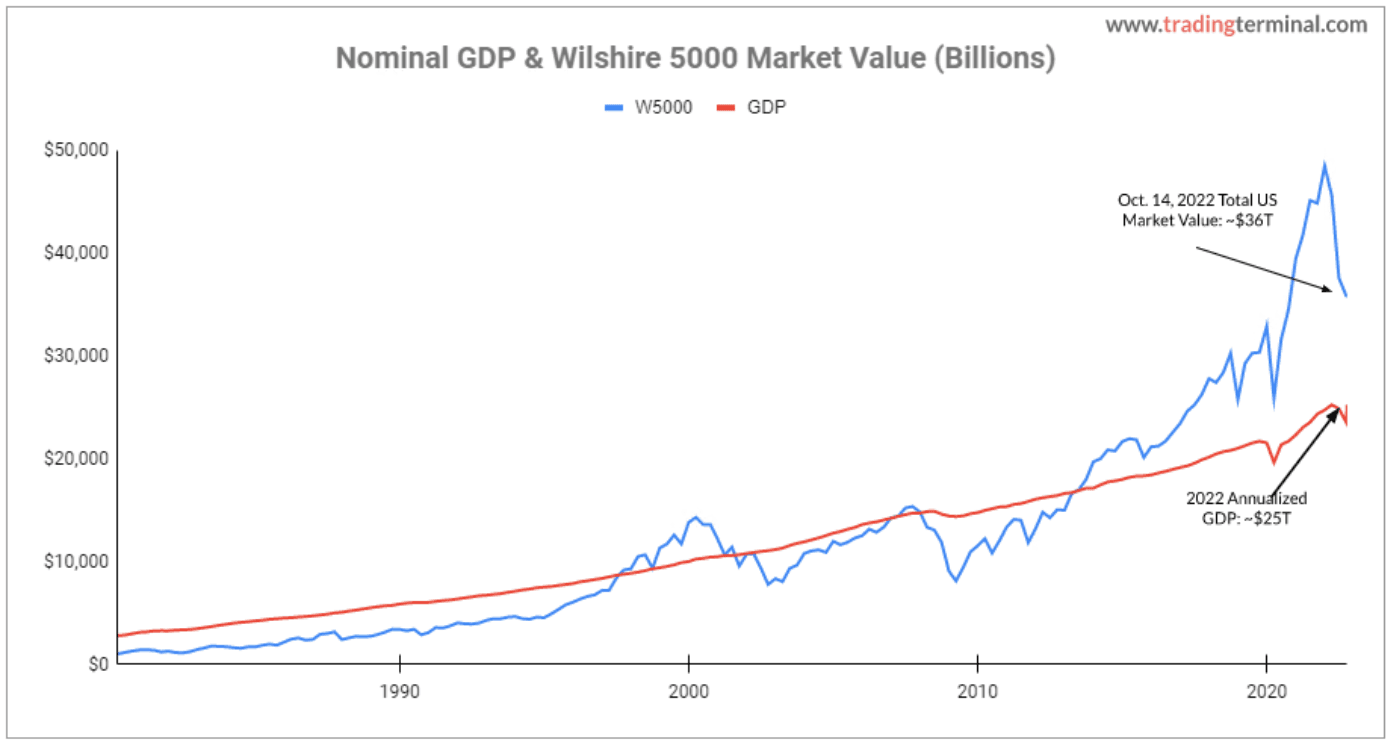
The BI is determined below by dividing the U.S. total market value by the U.S. GDP. In this case, the Wilshire 5000 Total Market Index represents the total market value because it’s widely accepted as the benchmark for the U.S. equity market. Here is a link
to the Wilshire 5000 data that was used for the calculations. The GDP data, which represents the total market value of goods and services produced in the U.S., and it’s measured by the U.S. government’s Bureau of Economic Analysis on a quarterly basis.
As indicated in the chart below, the 2022 annualized GDP is ~$25 trillion, and it has shown consistent steady growth since 1980. Unlike the GDP, however, the U.S. total market value fluctuates over time, causing the BI to be volatile. As of October 14, 2022, the Total Market Index is $35,778 billion.
The chart below shows the BI at an all-time high in December 2021 at 196% – an indication that we were literally playing with fire. Fast forward to 10 months later and the U.S. total market was already down by -27%. Given that the current BI of 142% indicates the market is still overvalued, it looks like the market bottom is not yet upon us.
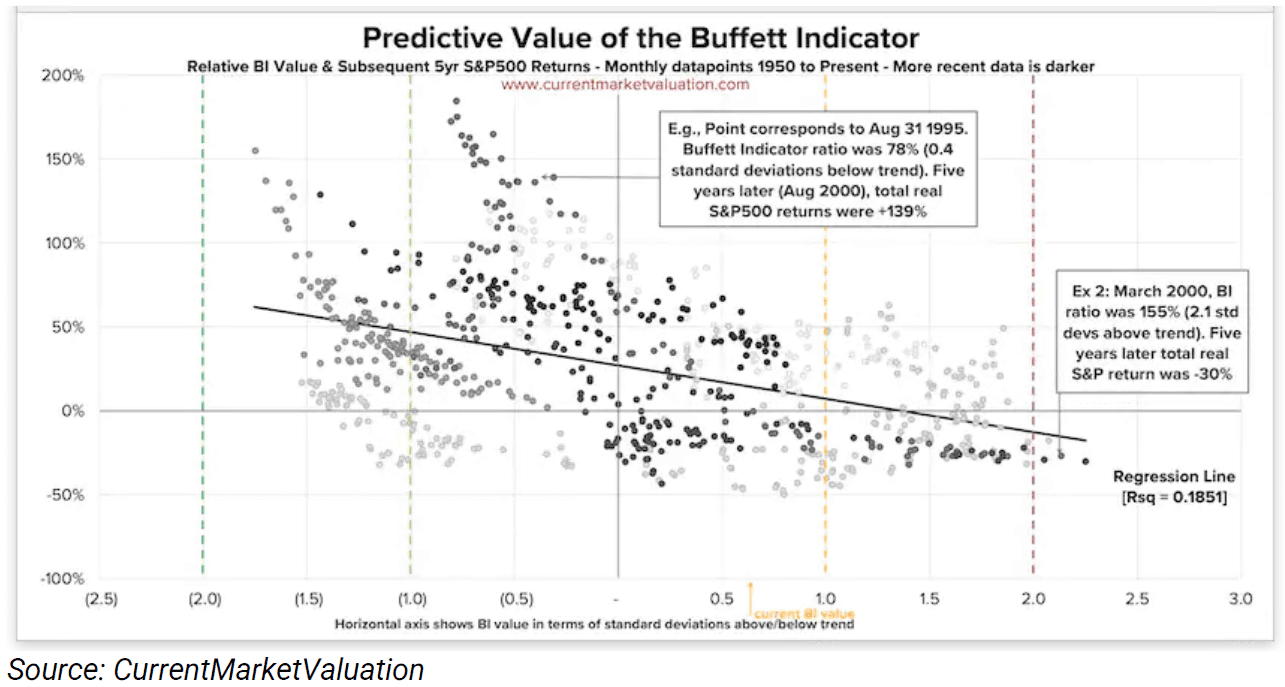
While the BI is not the holy grail, and it has its shortcomings, CurrentMarketValuation (CMV) analysis shows “there is a slight correlation between the Buffett Indicator and subsequent market returns,” as seen in the BI/market return predictive chart below. According to CMV, BI overvaluations, particularly at the extreme, tend to be followed by lower market returns (as indicated on the right side of the chart). Meanwhile, BI undervaluation periods tend to be followed with the highest stock market returns five years later (as shown on the left side of the chart).
The Bottom Line
As of October 14, 2022, the Buffett Indicator still shows that the market is overvalued, and if the past repeats itself, the red days are not yet over. We still need to brace ourselves for the worst to come – probably another decline of -10% to -15%. Who knows, perhaps we’ll start to see the bottom as we move to 120% BI and below. While most stocks are already down significantly YTD and look very cheap, it’s crucial to assess the geopolitical and global macro conditions, market indicators, and technical analysis before making investment decisions to avoid the danger of incorrectly predicting the bottom.
Disclaimer: The content and materials available on this site are not intended to serve as financial, investment, trading, or any other form of advice or recommendation from Trading Terminal.
Femi Agboola, CFAFemi is a data-driven professional investor. He uses both technical & fundamental analyses to make investment decisions. He also specializes in strategically driving the financial planning process to achieve impactful and profitable business goals.
More from Femi Agboola, CFA
 December 28, 2024
2025 Outlook: Historical Cycles and the Case for a Sustained Bull Market
 December 28, 2023
Why I’m Bullish on the Stock Market in 2024: A Historical Perspective
 May 31, 2023
NVIDIA: Leading the AI Pack for Investment
 May 5, 2023