
The Finimize Momentum Rider Portfolio
Idea
Holding just stocks would’ve been a winning move over the past ten years, but that doesn’t mean it will be over the next ten. They’ve taken huge hits before (like drops of 80% or more) – and they could again. So-called lost decades are real too: shares actually underperformed cash in the 1930s, 1970s, and 2000s. With today’s record-high valuations, stretched margins, and an investing audience that’s maxed out on the market, the margin of safety is perilously slim. Ideally, you’ll want a portfolio that can deliver returns even if the future fails to meet everyone’s lofty expectations.
So that’s what I had in mind when I designed the Finimize Momentum Rider Portfolio. The model constantly adapts to investing conditions and aims to deliver stock-like returns but with way less risk. And the best part is, this approach is entirely rule-based, which means it removes your emotions from the equation – no more second-guessing every move or panicking about bubbles. Instead, you make data-driven decisions, keeping your cool while your portfolio adjusts to the market’s rhythm. Oh, and it tells you what to do with bitcoin…
Thesis
Key risks
This is a new type of analysis: detailed research into a model portfolio aimed at helping you invest smarter. Let us know your thoughts, and what you’d like to see next.
Simply, it’s a nimble, adaptable asset mix. By dynamically picking top-performing assets from a diversified universe and shuffling into bonds when markets dip, it adjusts to changing environments, aiming to generate stock-like returns over the long run but with much smaller losses.
Here’s how it works: rather than just keeping a diversified, static investment mix, Momentum Rider uses price momentum – the idea that what’s been going up will tend to keep climbing, at least for a bit – to select which asset to own and when. It starts with relative momentum, stacking different asset classes against each other to see which ones are holding strong in today’s economy. If an asset is shining in the current climate, it’ll stay in your mix. If not, you’ll discard it.
But there are times when almost everything is falling. And when that’s the case, picking the "least bad" assets won’t cut it. That’s where absolute momentum comes in. It goes a step beyond picking the best assets: it makes sure they aren’t trending downward. If they are, you pivot into bonds instead to keep your money safe.
The Momentum Rider Portfolio draws from the same ETF lineup as the Finimize Easy Rider Portfolio, so you've got three diversified stock indexes (US, international, and emerging markets), two government bond indices (US long-term Treasuries and global government bonds), a broad commodity index, plus gold and bitcoin (some sample tickers are listed below). It’s a little stock-heavy, but it’s built to cover all economic bases: stocks thrive in strong growth and low inflation, bonds do well in weak growth and inflation, commodities shine in high growth and inflation, and gold steps up in times of weak growth and inflation.
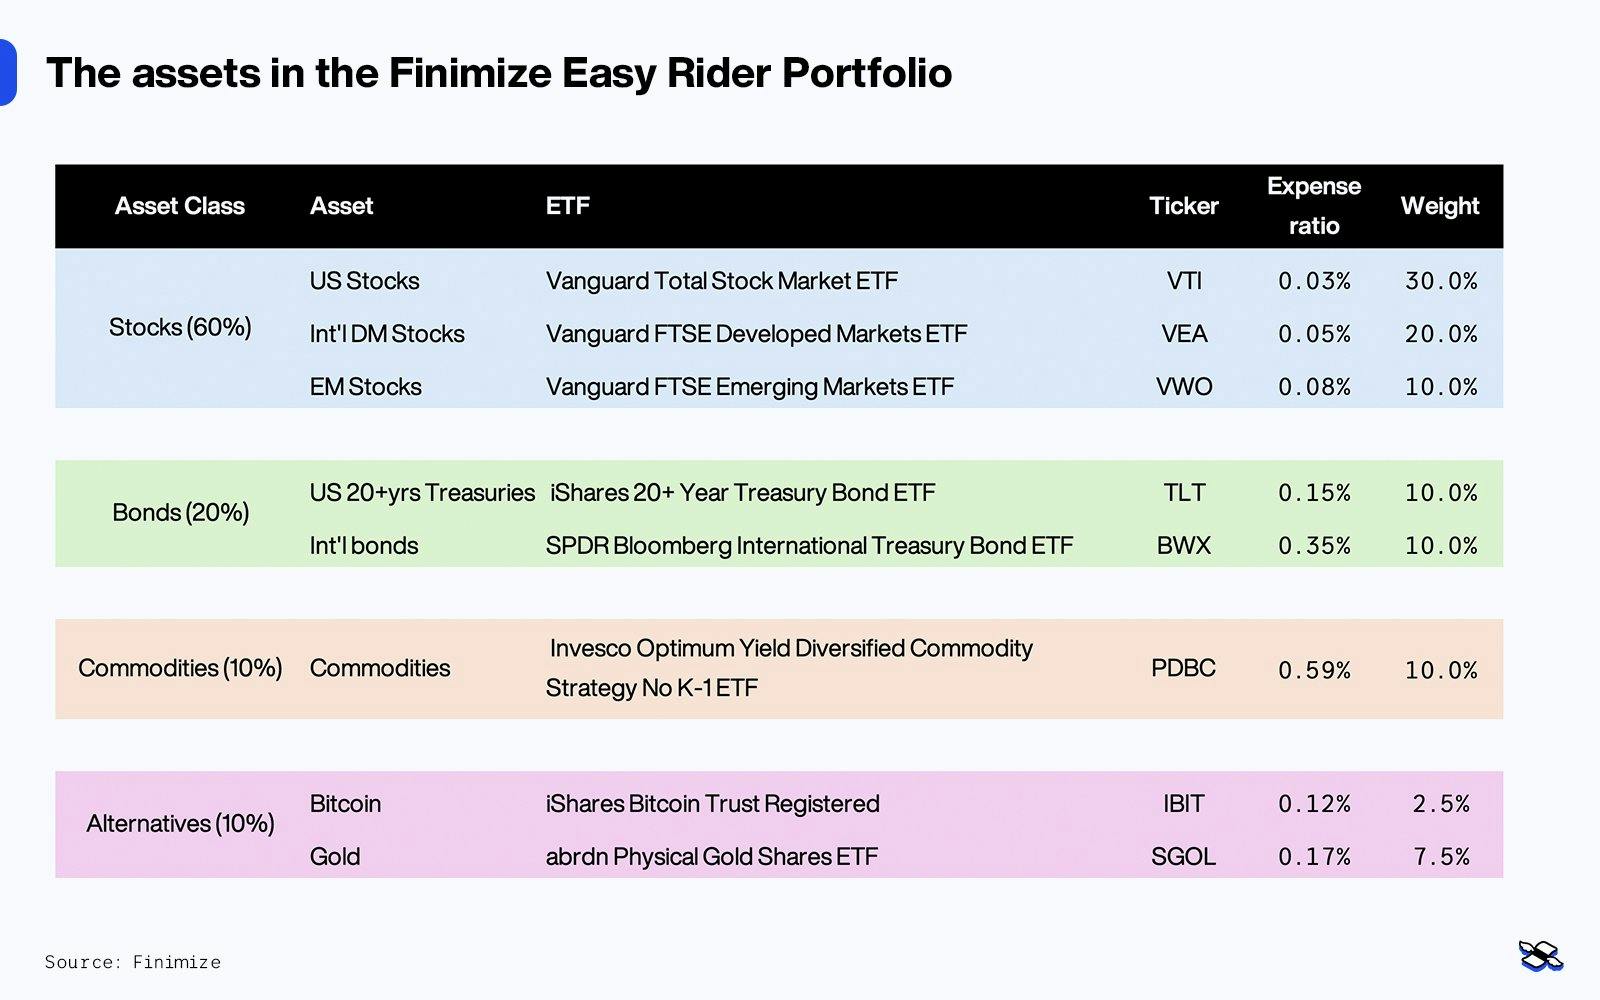
Now, with this portfolio, I’ll treat bitcoin a bit differently, and there are three reasons for that. First, I want to do backtests without it to keep the results realistic – because, let’s be honest, the odds that you’d have picked up this top performer from its cheapest, earliest days are pretty slim. Second, not everyone is wild about bitcoin, so I want to make sure the strategy is flexible enough to work without it. And third, bitcoin’s rowdy volatility means it can completely overshadow the risk and returns of everything else (for better or worse), so it needs a category of its own.
This is your game plan: on a set day each month (or even every two months or every quarter, but we’ll get to that later), you’ll go through a simple five-step routine. But, if you prefer not to crunch the numbers yourself, no worries: I’ll post updated results here every month. These are the steps:
Calculate momentum signals. For each asset, you’ll work out its average return over the past three, six, nine, and 12 months. Using multiple timeframes will help smooth out volatility and temporary price swings, giving you a clearer view of each asset’s trend and allowing you to focus on steady performers, not choppy ones.
Rank assets by their relative momentum. Sort the assets based on their momentum signals to get their relative momentum (excluding bitcoin for now). Then, choose the four with the strongest momentum as your “buy” or “long” candidates, and leave out the four assets with the weakest signals.
Check absolute momentum. For each of the top four assets, make sure its momentum score is above that of cash (essentially confirming that it’s been trending upward). If so, you’ll buy the asset. If not, you’ll put that portion into the Vanguard Total Bond Market ETF (ticker: BND; expense ratio: 0.03%), which holds a mix of high-quality US bonds.
Size your positions. Keep things simple by using equal weightings. So that’s 25% in each position if you prefer to exclude crypto – otherwise 24% in each, plus a 4% position in bitcoin.
Execute your exit strategy. Follow the same rules for exiting an asset as for entering: drop a position if it’s no longer in the top four or if its momentum falls below cash. As long as an asset is in the top four, keep holding on. You could consider rebalancing every month to return to your target weights, but that’s up to you.
Now, about bitcoin: if you want to include bitcoin, you’ll simply check whether it’s among the top four assets for relative momentum, following the steps above, and whether its absolute momentum is positive. If it meets both criteria, you’ll allocate just 4% of this portfolio to it. If not, you’ll shuffle that money into the bond ETF. With bitcoin, the idea is to hold a smaller position so its volatility doesn’t dominate your performance. Of course, you can adjust this weight up or down if you prefer, just make sure you adjust the other positions proportionally to maintain your 100% investment allocation.
If you followed those five steps on the last trading day of October, you’d have 24% in each of these assets if including bitcoin (or 25% each if excluding the OG crypto):
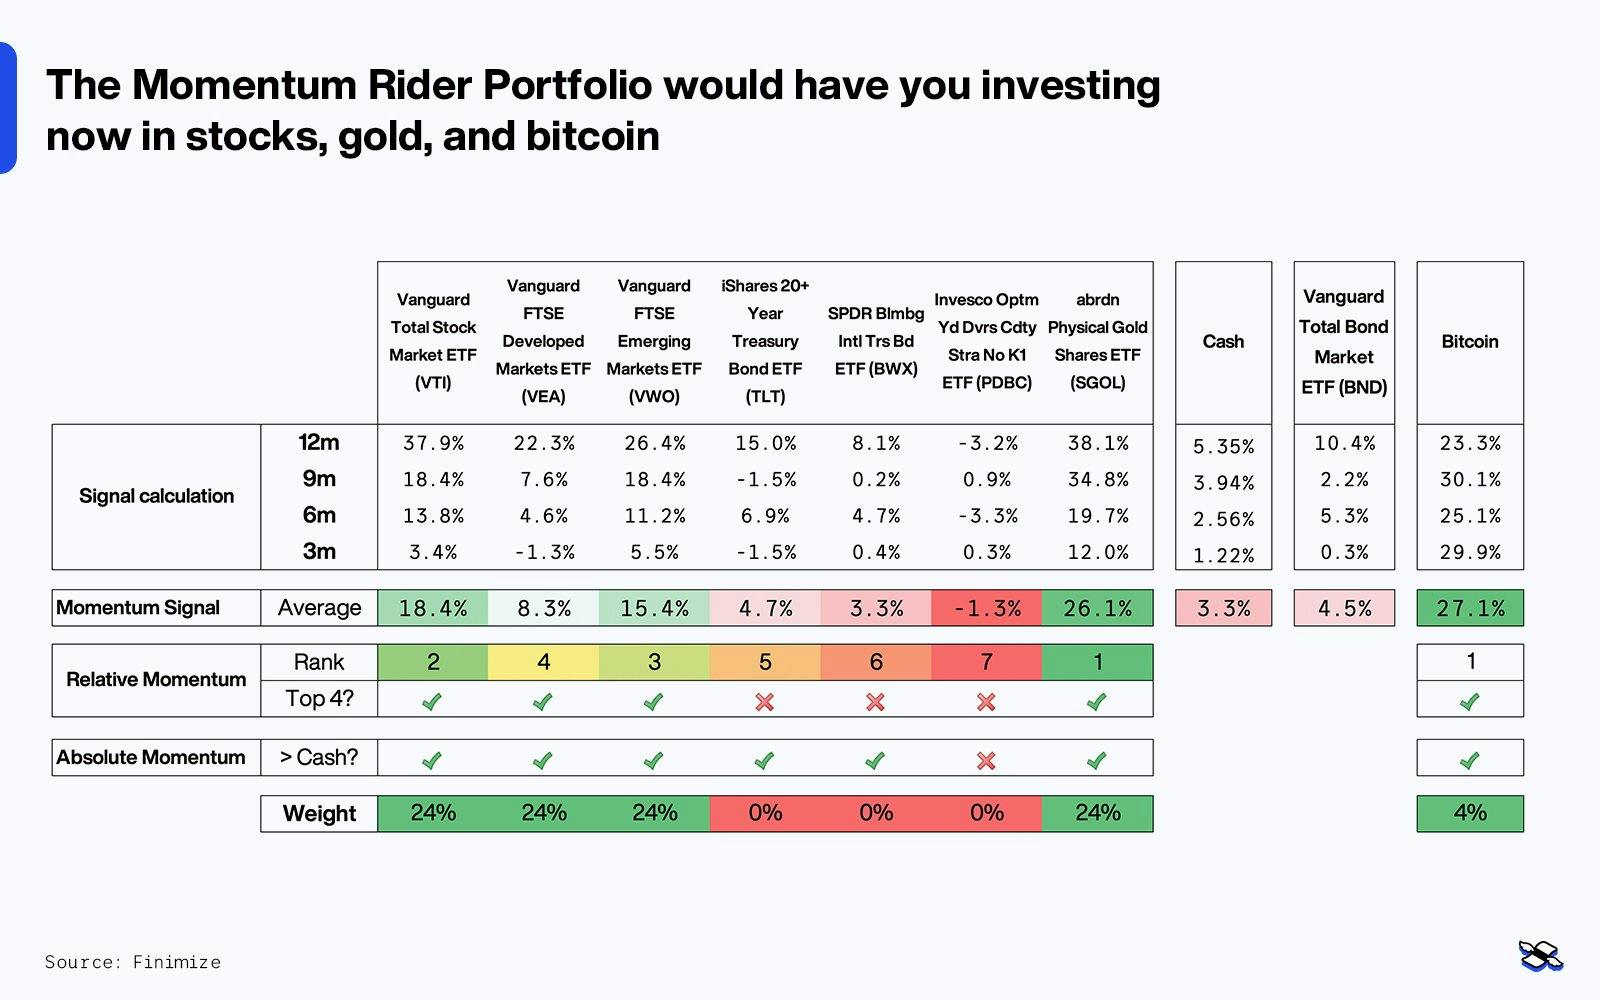
As you can see, gold currently shows the strongest price momentum, not just over the past 12 months, but also across all the lookback periods (as of October 31st). Developed market stocks may have weaker momentum compared to the other stock segments and gold, but they still rank fourth (excluding bitcoin) – so they make the cut. And since each of the top four assets shows positive absolute momentum, you would go ahead and buy all of them. Oh, and with bitcoin firing on all cylinders, you’d also give a 4% weight to it, unless you specifically want to bodyswerve crypto.
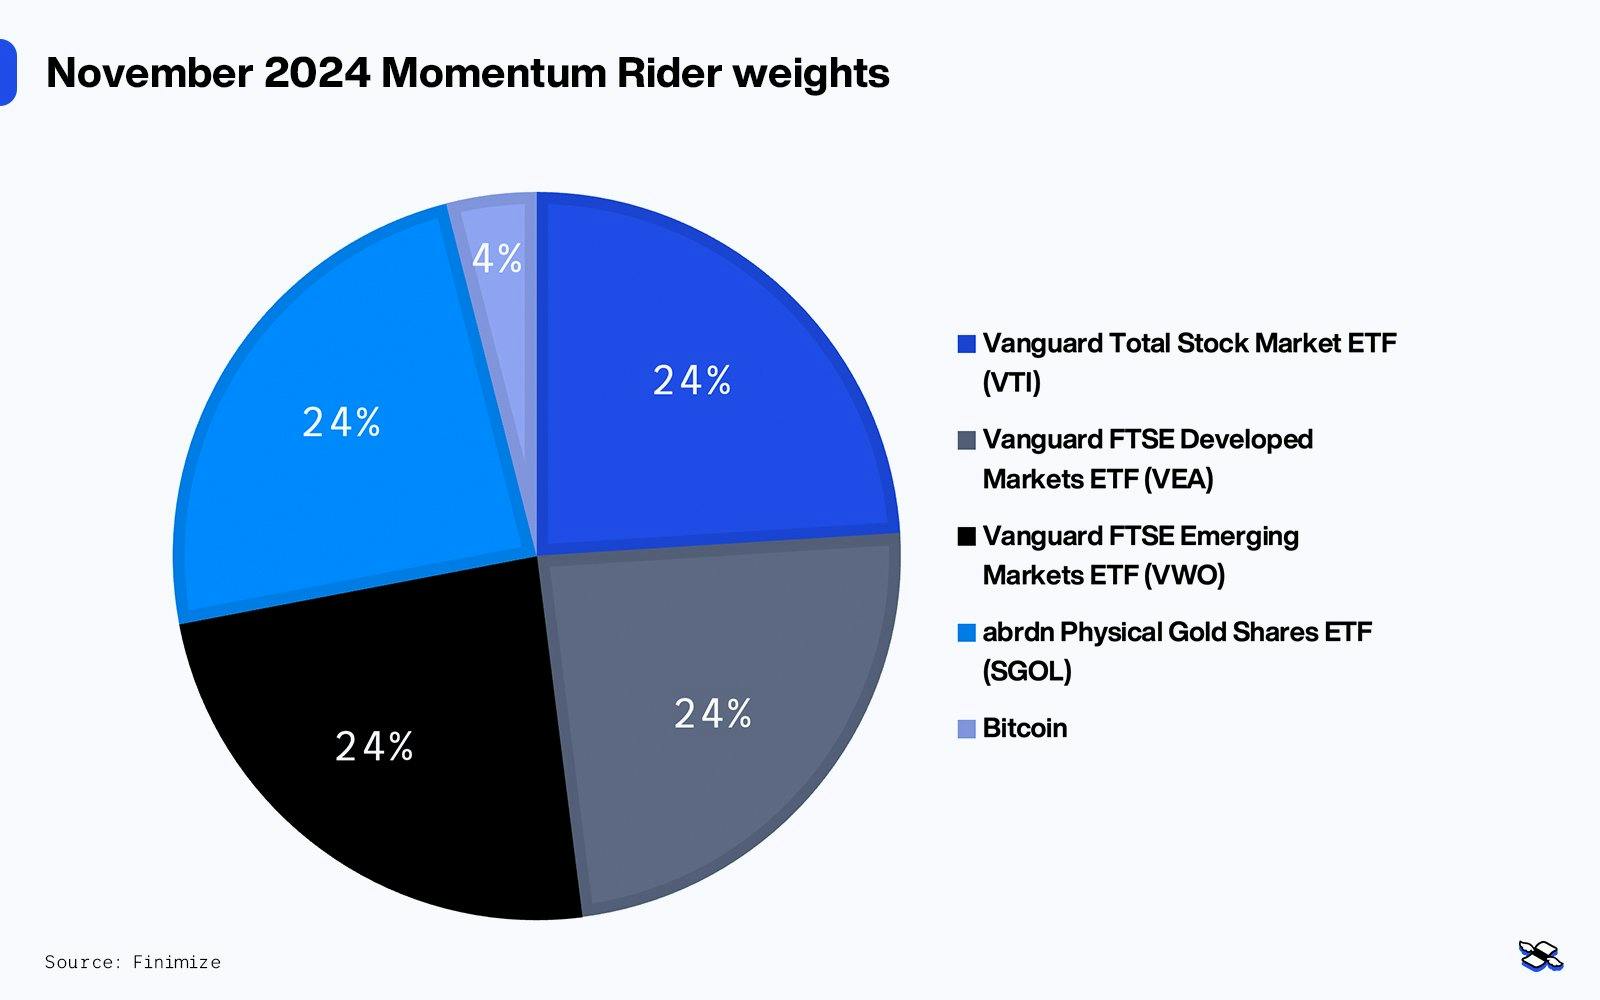
The difference between the Momentum Rider Portfolio and the Easy Rider is clear: while Easy Rider holds assets like bonds and commodities all the time, its momentum-driven cousin is more selective. Right now, it’s keeping away from bonds and broad commodities because they haven’t been performing as well. This makes the Momentum Rider Portfolio a more concentrated portfolio that can pivot faster as trends shift.
Here’s how a $10,000 investment in the Momentum Rider Portfolio would have grown over the past 28 years (without bitcoin in the mix) – and how it would have stacked up against the Easy Rider (also without bitcoin) and global stocks.
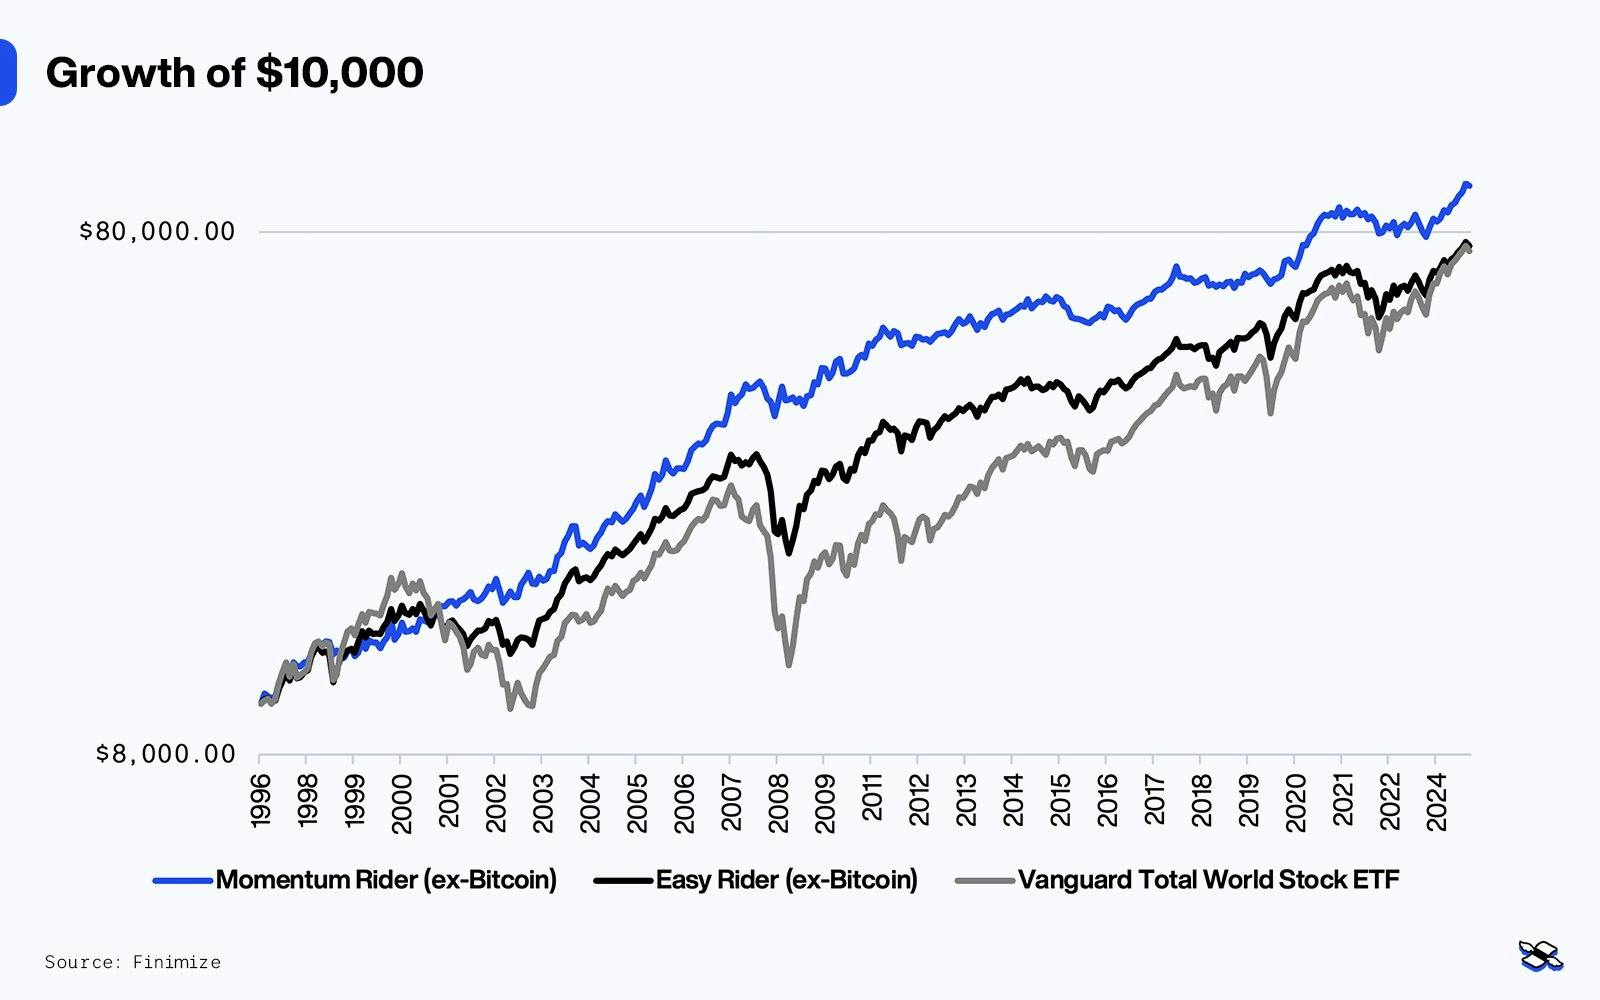
Since January 1st, 1997, the Momentum Rider Portfolio has delivered an annual return of 8.6% – compared to 7.4% for global stocks. So if you’d invested $10,000 at the beginning of that period, it would have grown to $98,100 by October 2024 – nearly $25,000 more than the $73,500 you’d have if you’d put the money in global stocks instead.
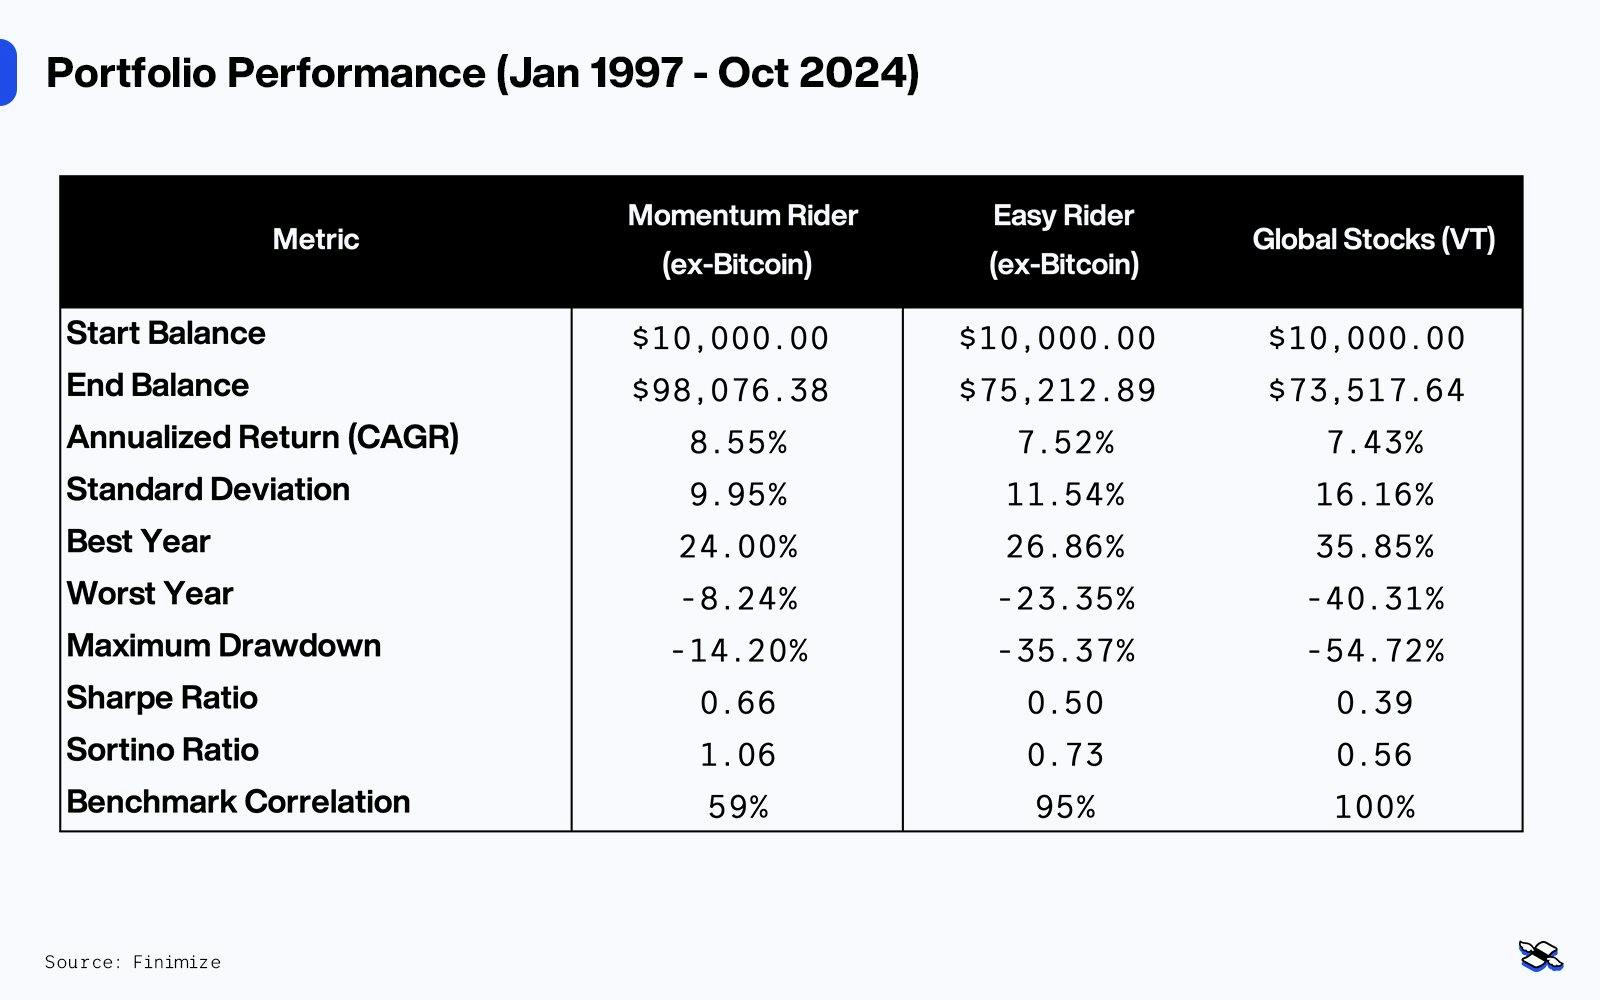
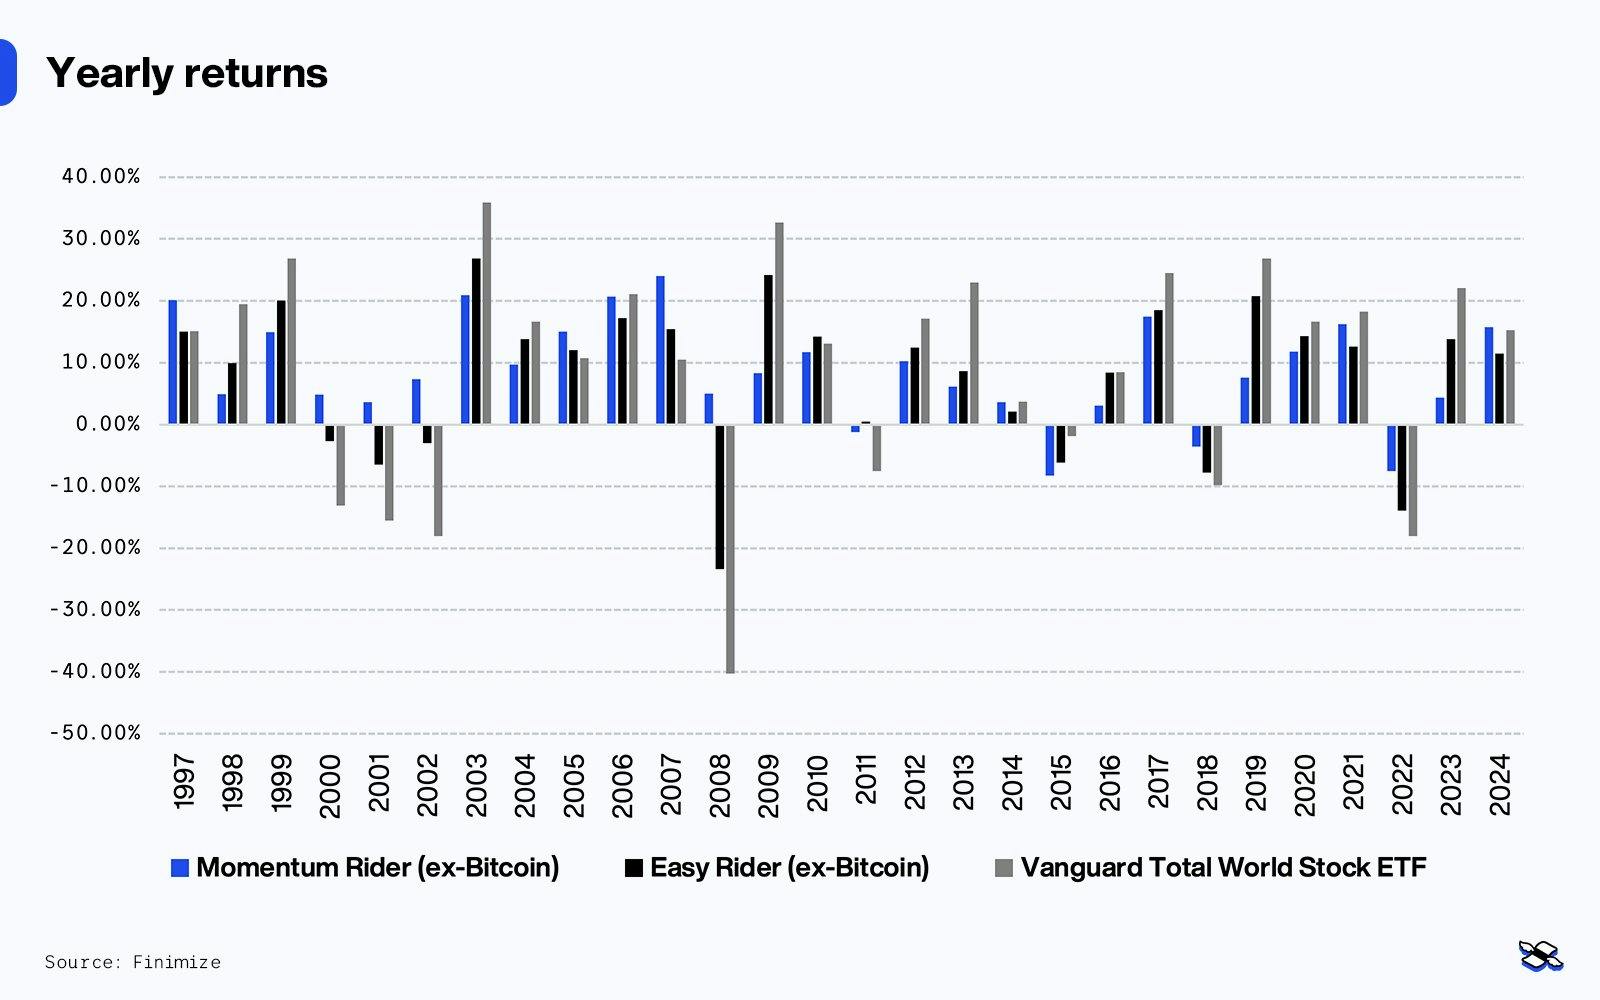
The strategy posted gains in 24 out of 28 years – with no single calendar-year loss exceeding 8%. Compare that to just 20 positive years for global stocks, which had a maximum single-year loss of 40%). Unlike global stocks, It never experienced losses over a three-year horizon.
While the Momentum Rider Portfolio did underperform global stocks in several years (especially in the boom that followed the recovery from the global financial crisis), it proved resilient during that crisis and the dot-com crash, and it avoided any yearly losses during those turbulent times. In fact, overall, it delivered a much more consistent performance than global stocks – and even outpaced the stability of Easy Rider Portfolio.
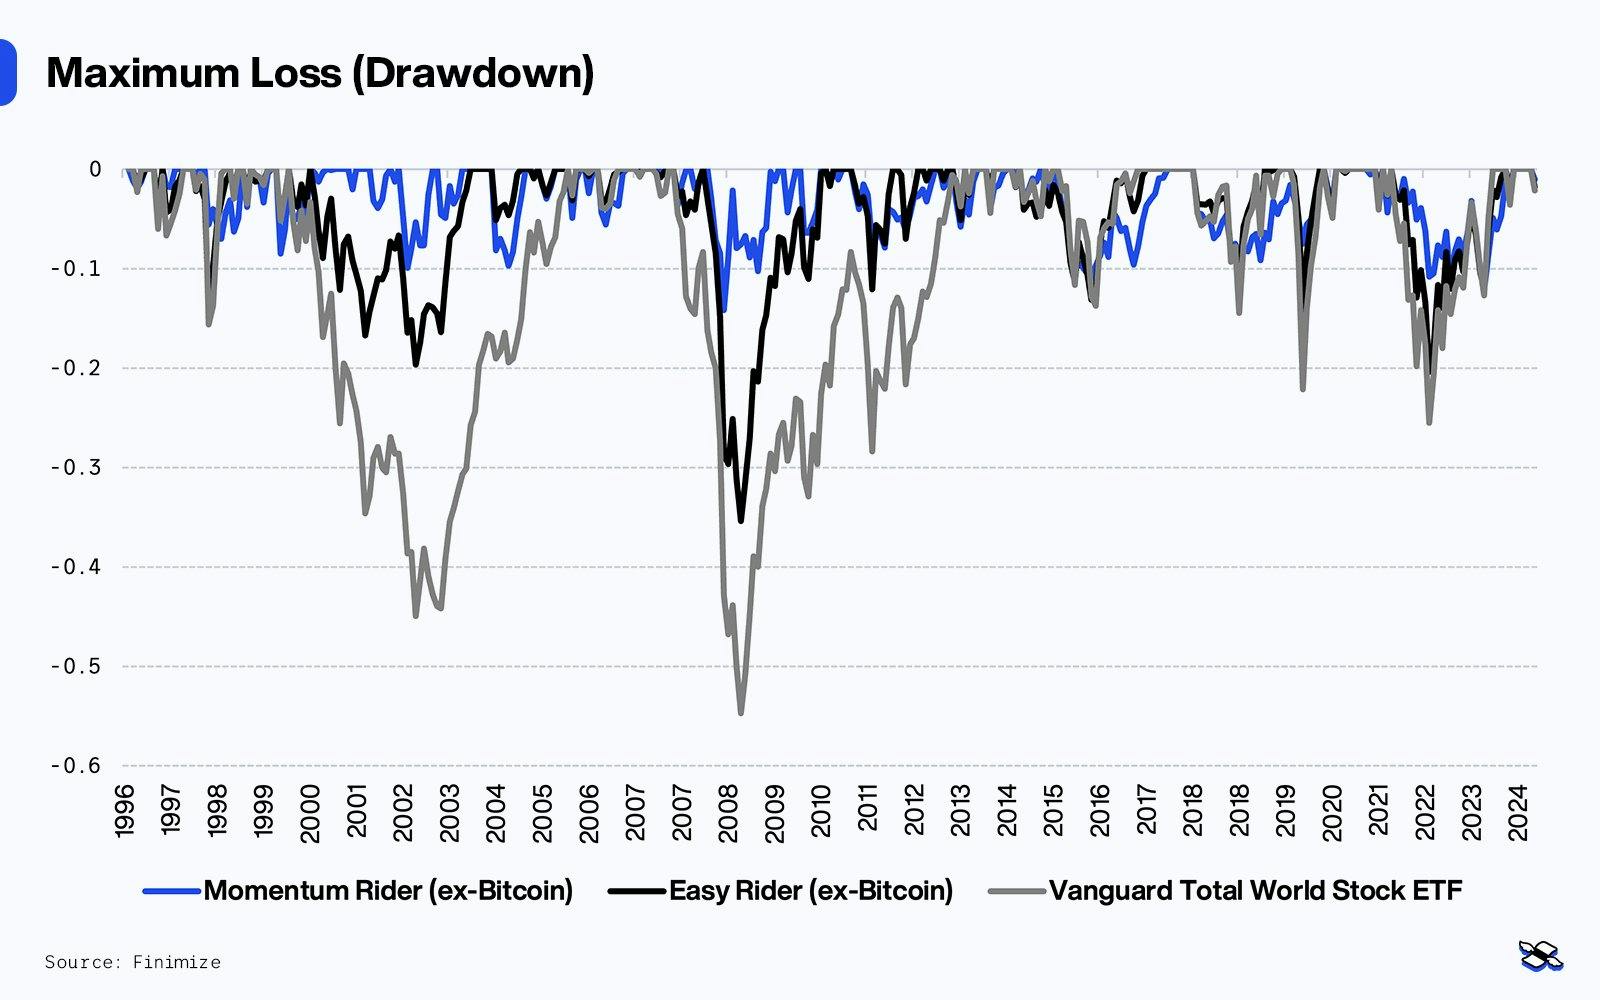
Impressively, the Momentum Rider not only outperformed global stocks and the Easy Rider in returns (though transaction costs could narrow the gap depending on what you pay to trade), but it did so with far smaller losses. As you can see in the charts, the journey was much smoother, with no heart-stopping drops along the way.
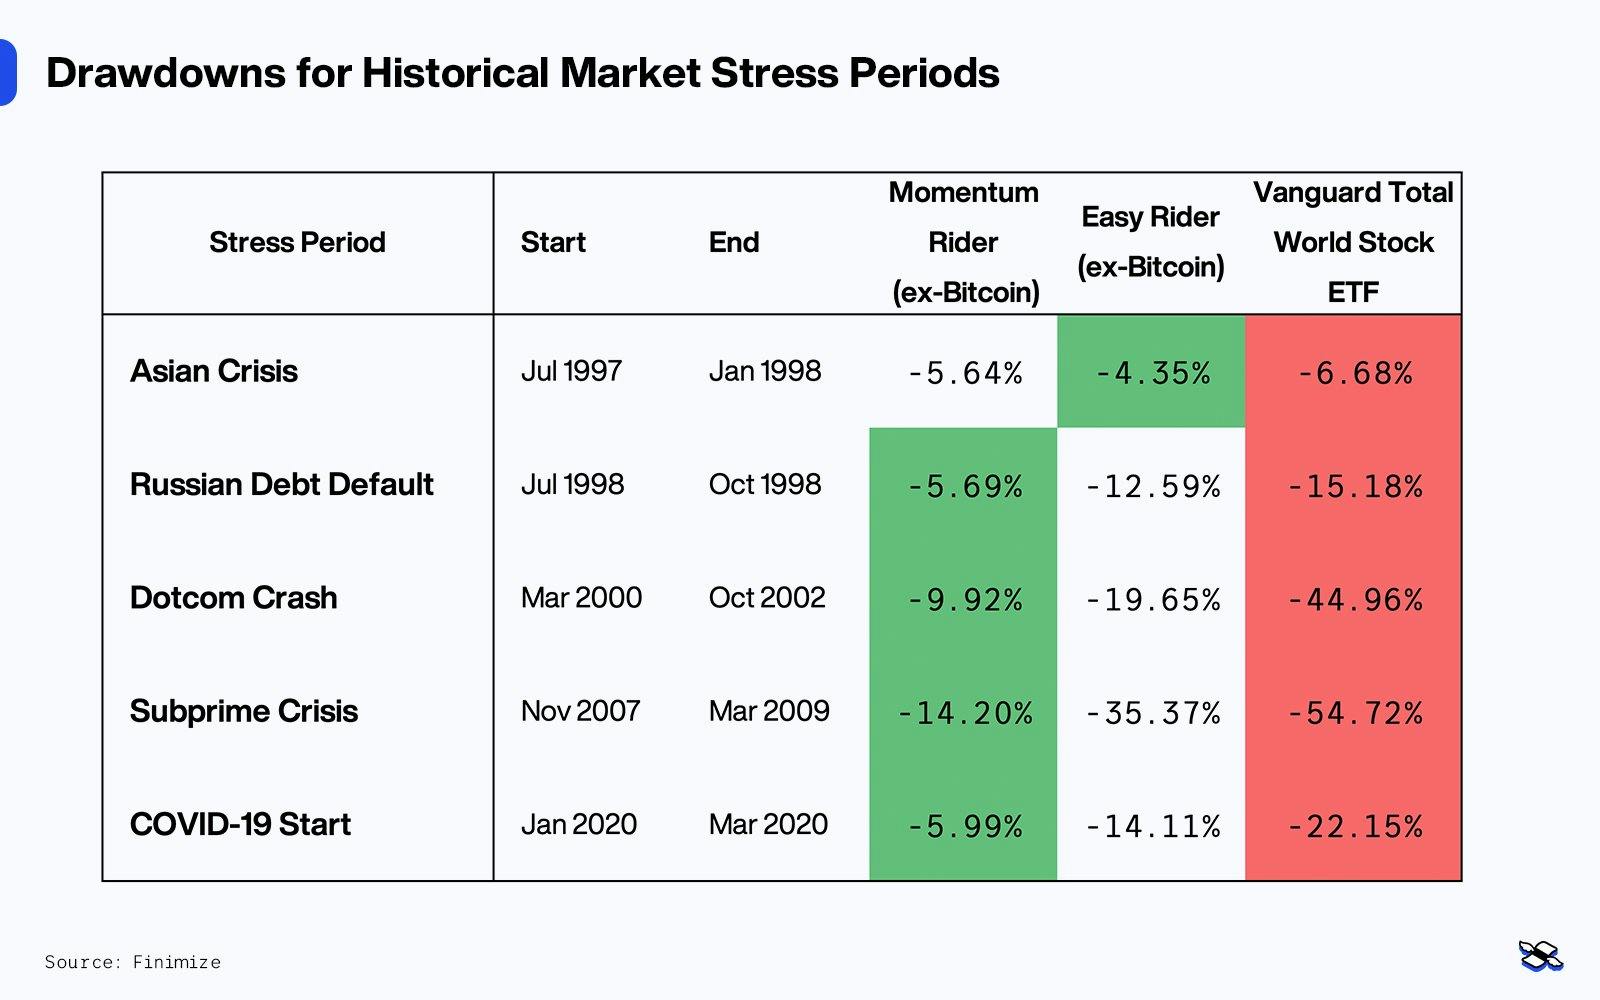
The Momentum Rider also held up better in nearly every major market stress period, with much smaller losses than global stocks or the original Easy Rider. We’re talking about huge events here like the Russian debt default, the dot-com crash, the global financial crisis’s subprime debacle, and the pandemic crash.
Achieving similar returns with much lower risk – whether through smaller losses or less volatility – can make all the difference as you build wealth. This portfolio’s lower volatility means that you’ll have a better shot at actually realizing its average return (unlike with stocks, which can see widely varying returns, even over a few years). And its smaller losses reduce the chances that you might make the worst move at the worst possible time, like selling in the middle of the downturn and missing the subsequent rally. Plus, its structure frees up more of your money, so you can seize the opportunities that pop up right after a fall.
I put the Momentum Rider through its paces: trying different lookback periods, excluding assets one by one, adjusting weightings, changing rebalancing intervals, and even altering the number of assets held. And the strategy held up across the board. Here are some takeaways.
Perhaps even more importantly, you can understand why it works: the economy moves in cycles, and investors aren’t always perfectly rational, meaning prices can take time to adjust to a new economic reality. That combo fuels long-term trends that our momentum approach can ride. Momentum isn’t just popular – it’s one of the most tested and proven approaches in finance, delivering consistent results across decades and asset classes. So as long as these cycles and behaviors stick around, this simple, straightforward strategy should keep producing solid returns with manageable losses over the long haul.
Now, let’s look at the strategy with bitcoin included. Using the OG crypto’s cash prices, I tested all the way back to 2016, allocating 4% to bitcoin when it both ranked in the top four assets by relative momentum and showed positive absolute momentum.
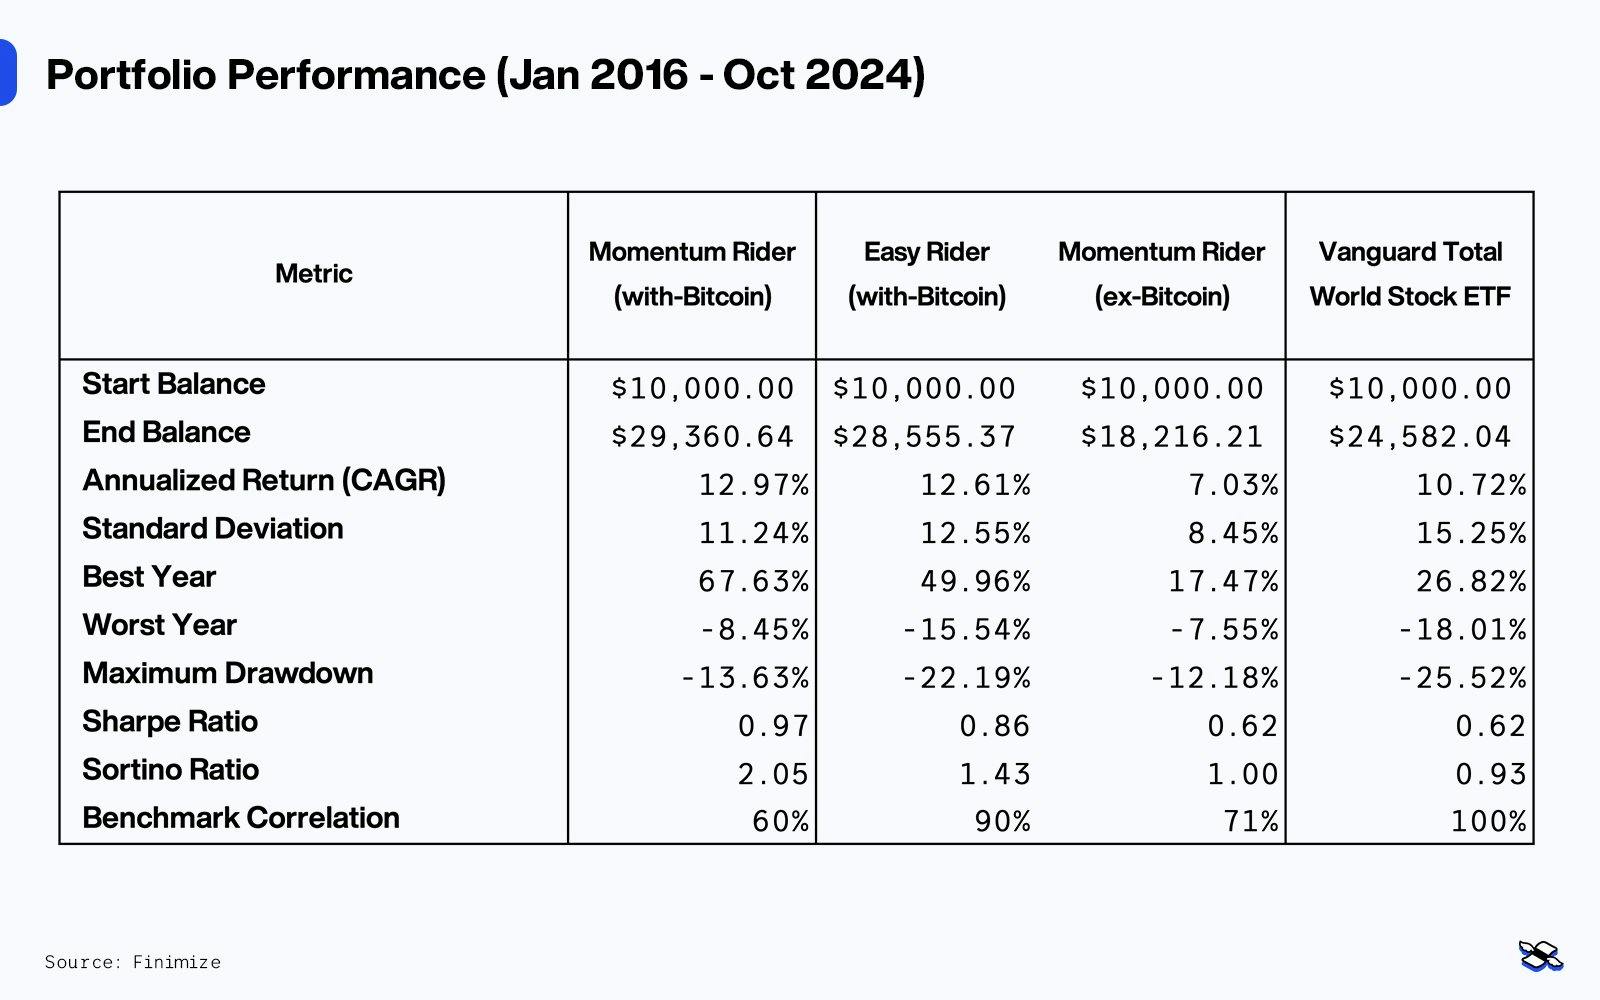
The strategy delivered a 13% annual return (versus 10.7% for stocks) with only a mild 14% drawdown (compared to 25% for stocks) over the period. And that was before bitcoin’s post-election run.
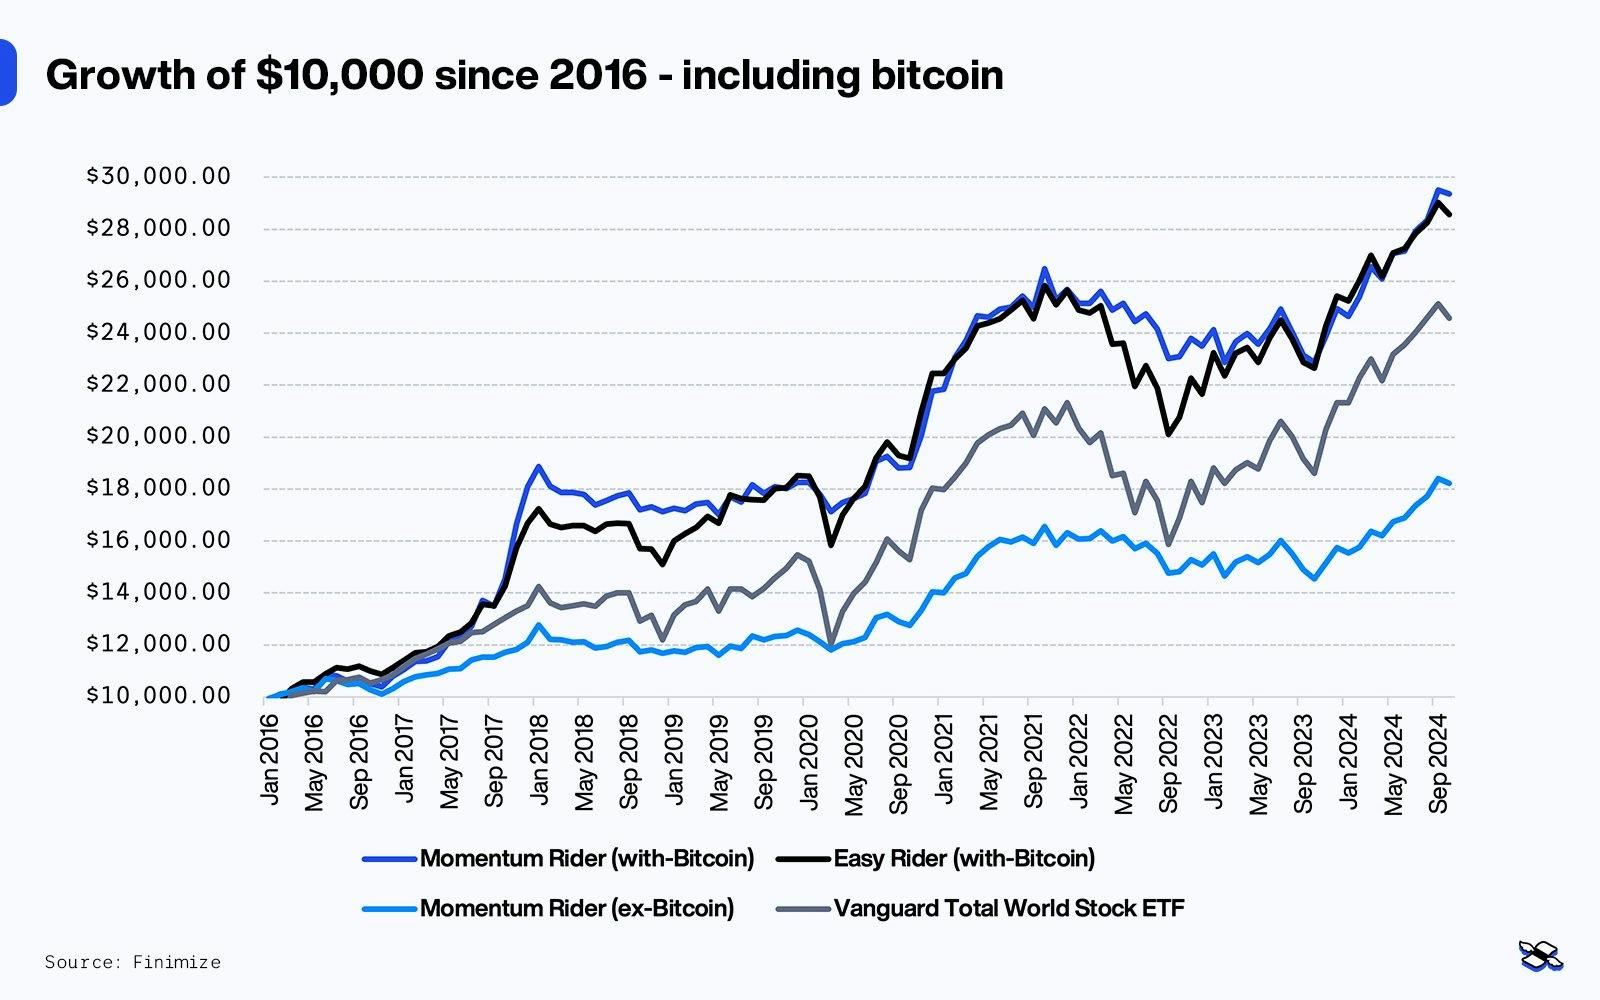
And that meant it outperformed the Easy Rider passive strategy (including bitcoin), with slightly higher returns and lower risk. As for risk-adjusted returns, it did impressively well, scoring more than double the Sortino ratio of stocks. Once again, this shows the power of the portfolio’s strategy both in preserving returns and in cutting losses short.
Because of its momentum bent, it plays both sides of the field well – offense and defense.
The Momentum Rider Portfolio is great at dynamically picking top-performing assets. With a more concentrated portfolio, choosing the right assets has led to higher returns compared to the more diversified original Easy Rider Portfolio. Case in point: When I reran the strategy using only relative momentum, it delivered an impressive 9.9% annually, with 10.7% volatility and a max drawdown of 20%, showcasing the “offense” prowess of selecting assets based on their price momentum. Of course, its stock-heavy universe helps in a bull market, too – allowing for a bigger stock position overall.
But the portfolio’s “defense” works just as well. The strategy moved partially out of markets 30% of the time, cutting losses by exiting assets when they weren’t performing as well and picking the low but steady returns of bonds instead. This approach boosts returns but, more importantly, it avoids steep losses – remember: a 50% loss requires a 100% subsequent gain just to break even.
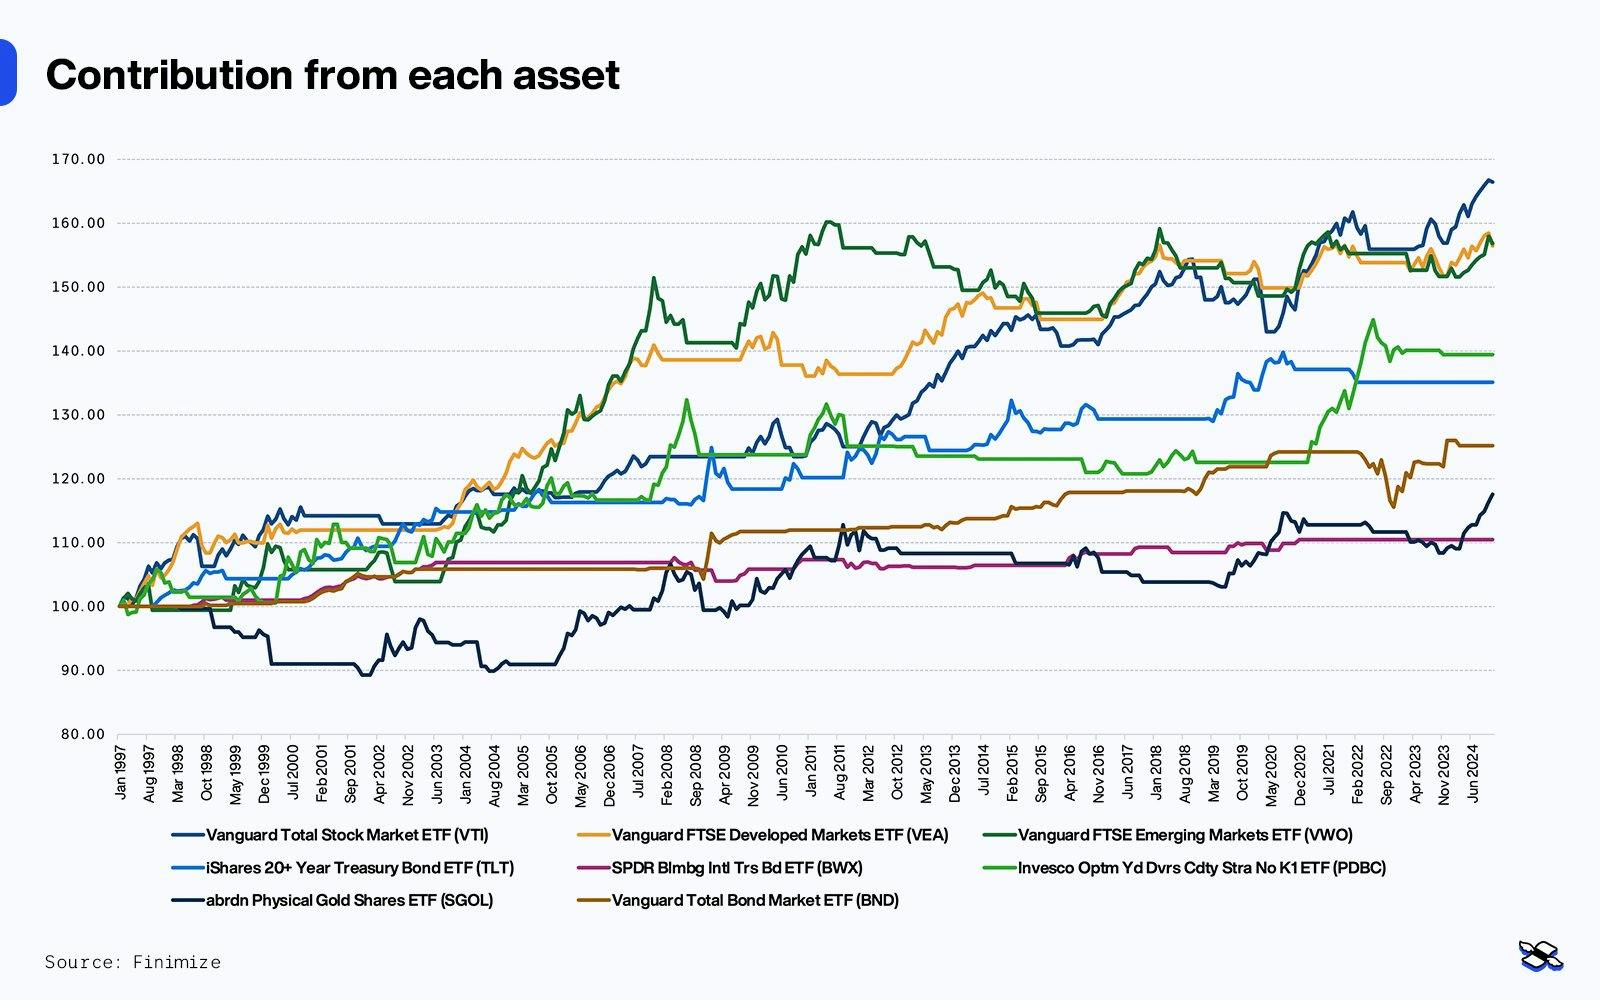
A close look at each asset’s contribution shows the strategy’s strength: it captures gains when assets trend up and cuts losses quickly when they don’t. There were a few sudden “whipsaw” moves along the way (gold in the late ’90s, emerging market stocks in the 2010s, Treasury bonds in recent years), but the short-term losses were offset by gains when those assets trended higher again.
Every strategy has its risks and weak spots. And this one has four.
Turning points. Like the Sector Momentum Edge, this strategy takes its cues from past trends, so it can lag when markets shift quickly – which could have you missing the boat on new trends or holding onto yesterday’s winners even after they’ve become today’s losers. So at key turning points, like in 2009 and 2023, you might find your portfolio underperforms.
Choppy, sideways markets. In markets without a clear direction, frequent reversals can lead to whipsaw effects – where you’re in and out at all the wrong times, racking up small losses instead of capturing meaningful gains. This would’ve happened with your emerging market stocks’ position after the global financial crisis, as failed rallies ate into returns. Luckily, strong gains in other markets helped offset those losses.
Fast, sharp crashes. With only monthly rebalancing, sudden market plunges can catch the strategy off-guard. If an asset (or the whole market) tanks between rebalancing dates, losses can pile up before there’s a chance to move into safer assets. While I didn’t see this in my backtest, it’s easy to imagine scenarios where it could happen in the future.
Periods of underperformance. There will be times when this strategy falls short compared to stocks – especially against top performers like the S&P 500 or the Nasdaq. You’ll need to be ready for that. Case in point: over the past five years, the strategy returned 6%, while global stocks delivered 9.5%. In 2019, it returned just 8% versus the S&P 500’s massive 31% gain. And from 2019 to 2021, it returned 36% compared to the S&P 500’s 78%. Short-term gaps can be even wider, so it’s important to understand and trust the strategy’s long-term philosophy – because over shorter periods, you’re bound to lag behind the top-performing asset of the moment.
In other words, even though I have a lot of confidence in the strategy, I can’t rule out that future losses might be bigger than what we’ve seen in the backtest, and that it could trail US stocks – or any other top-performing region – by a wider margin down the road.
The strategy’s robust, which means you can tweak it to fit your style and still get solid results. Want a more passive version? Try choosing your assets every two months instead of every month. Want an even higher level of protection? Re-run the strategy whenever markets see sharp moves – even if that means rebalancing between your usually scheduled dates. Want a higher-risk, more active version of this engine? Select fewer assets, or apply some reasonable leverage.
For a more diversified approach to investing, consider mixing this approach with the traditional Easy Rider Portfolio – maybe allocating 50% to each and using the pair as your core portfolio.
With both the Easy Rider Portfolio and the Momentum Rider Portfolio, I’ve sought to design strategies that are simple to understand and easy to manage – so you can implement them and run them yourself using ready-made tools like the ones on Portfolio Visualizer. Or, for an even easier approach, you can simply bookmark this page and come back for its monthly updates (you’ll find its current weights here). Either way, managing four ETFs once a month should take only a few minutes of your time.
So if you want to start now, remember: the current positions are 24% each to the Vanguard Total Stock ETF (VTI), the Vanguard FTSE Developed Markets ETF (VEA), the Vanguard FTSE Emerging Markets (VWO), and the abrdn Physical Gold Shares ETF (SGOL), plus 4% in the iShares Bitcoin Trust ETF (IBIT).
Disclaimer: The content and materials available on this site are not intended to serve as financial, investment, trading, or any other form of advice or recommendation from Trading Terminal.